Gantt Chart Improves the Efficiency of Project Execution
If you have to do a series of tasks in a project, either as a lone wolf or a member of a team, you can improve the efficiency of the execution of those tasks using a Gantt chart. This chart is pretty simple to create and to use, but its impact on your project planning and execution can be quite tremendous. It is often considered so important that for all personnel involved in the project, it is an essential tool to get their jobs done excellently and efficiently.
Gantt Chart Elements
A Gantt chart consists of at least three essential elements that define the schedules of all tasks included in a project. By visualizing the schedules, this chart allows all of those tasks to be accomplished in perfect harmony—hence harmonogram as another name for the chart. The three essential elements of the chart can be described as follows.
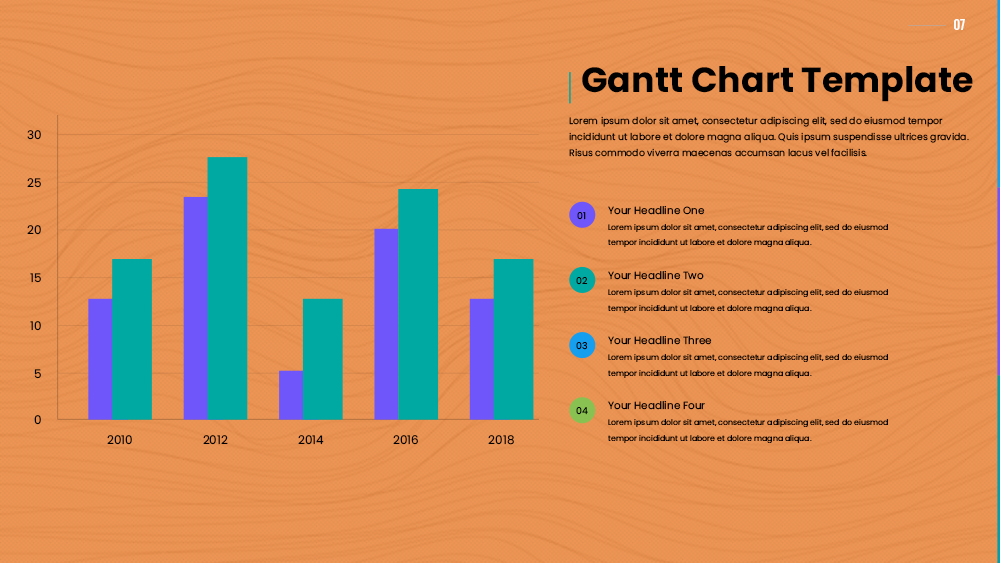
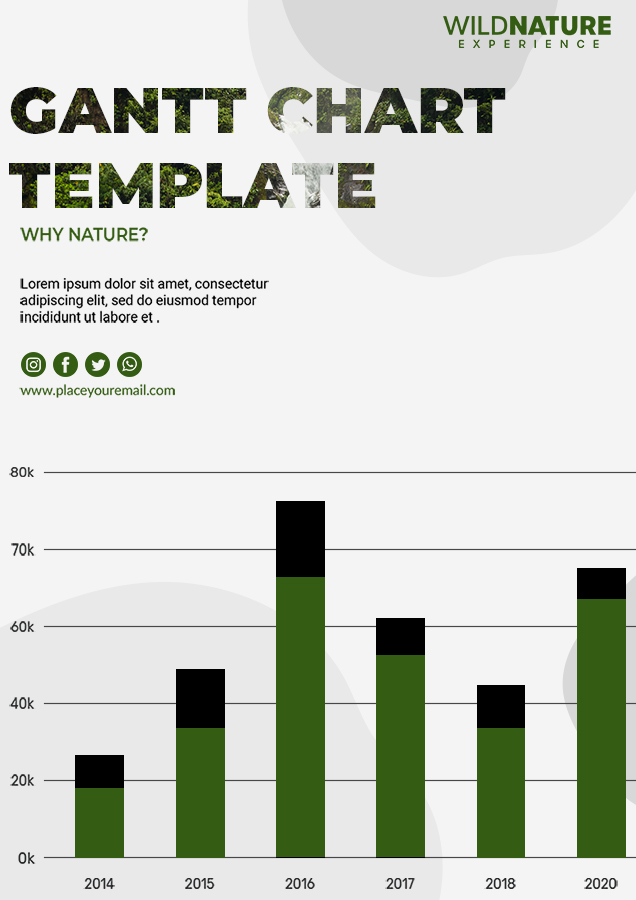
- The Vertical Axis
The vertical axis of the chart normally shows all tasks that need to be accomplished in a project. These tasks are arranged in rows so that they have their respective bars in the graph. Although the start and end dates of each task, as well as its duration, are visually represented by the bars, extra columns can be added on the right of the tasks to describe those data in alphanumeric form.
- 10+ ID Card PSD Template Free
- 10+ Greeting Card Free Template in PSD
- 10+ Concert Ticket Template Free PSD
- 10+ Event Program PSD Template Free
- 10+ Santa Letter Template Free PSD
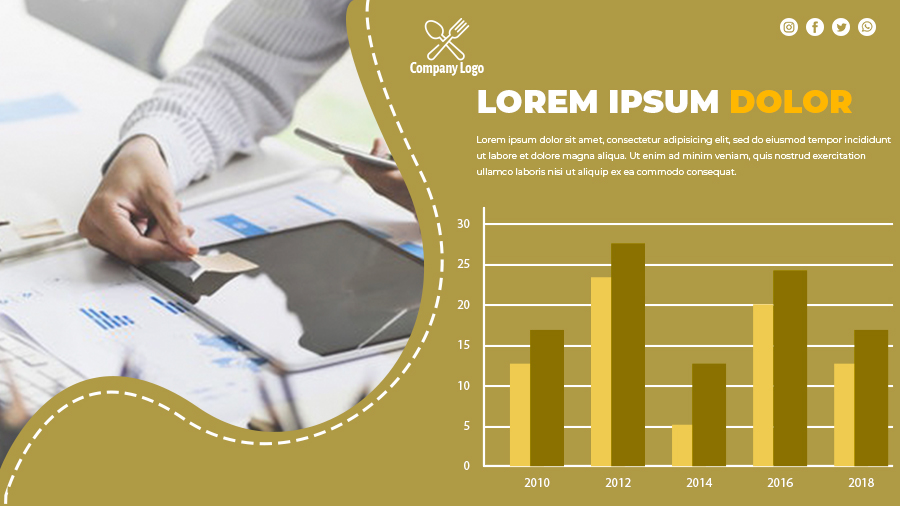
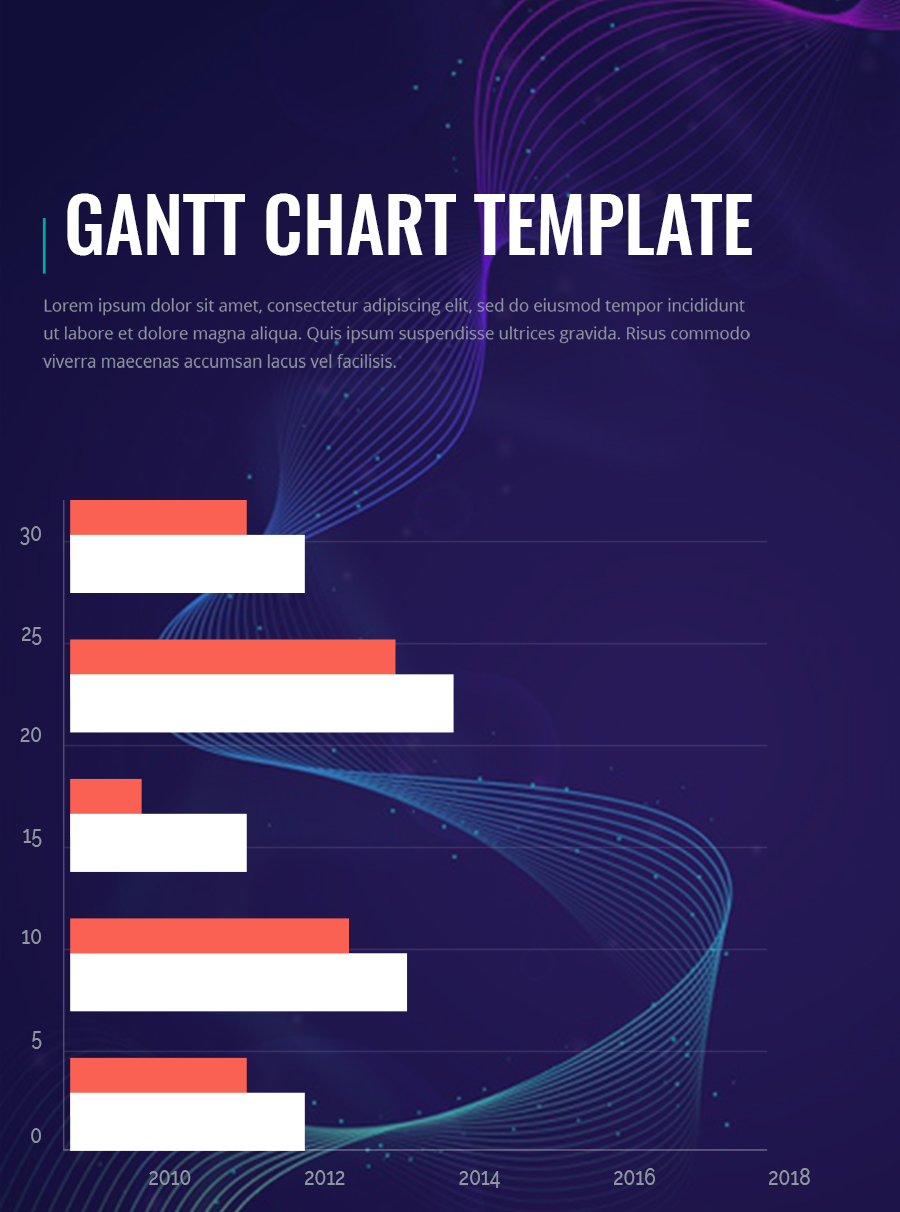
- The Horizontal Axis
The horizontal axis of the chart represents the timescale of the project, which is usually divided by specific time units (dates, weeks, months, etc.). The location of the chart’s horizontal axis can be at the top or the bottom.
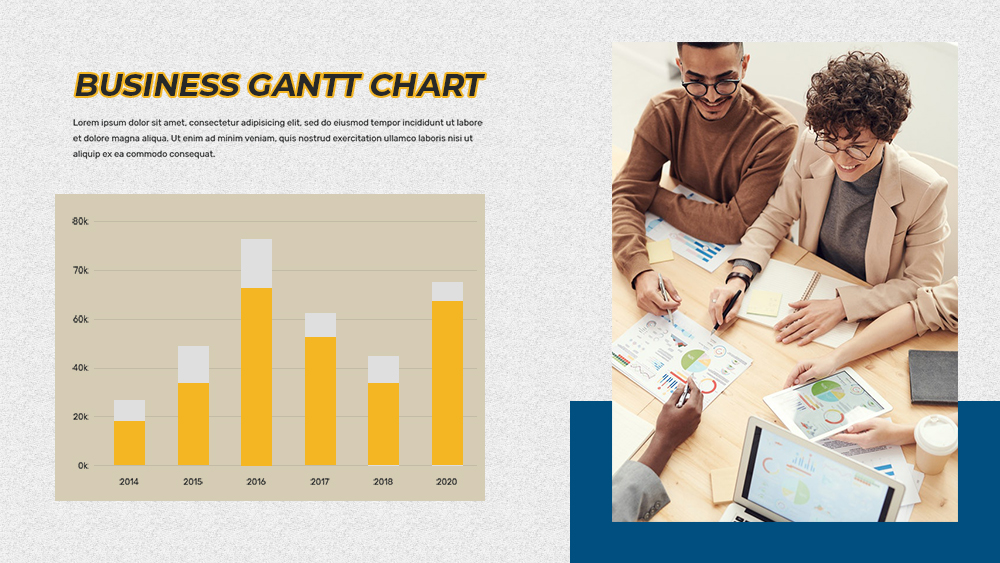
- The Bars
The bars are used to visualize the dates and duration of all tasks. As mentioned above, each task has its bar (one-time) or bars (repetitive). In a modern Gantt chart template, the bars usually have a specific color to distinguish them from the bars of other tasks. The bars give quick visual clues of which tasks overlap each other and which task is a continuation of or a prerequisite for another task.
Which Template to Use
The chart can be made using a pencil-and-paper method or digitally using a computer. If you plan to use a digital template, you should choose a template that you can edit easily and quickly. Generally, a Gantt chart is available in various formats that can be edited using a word processing application or anything else; however, the most preferable is always the one using spreadsheet (Excel) format because of the table-like appearance of the chart.