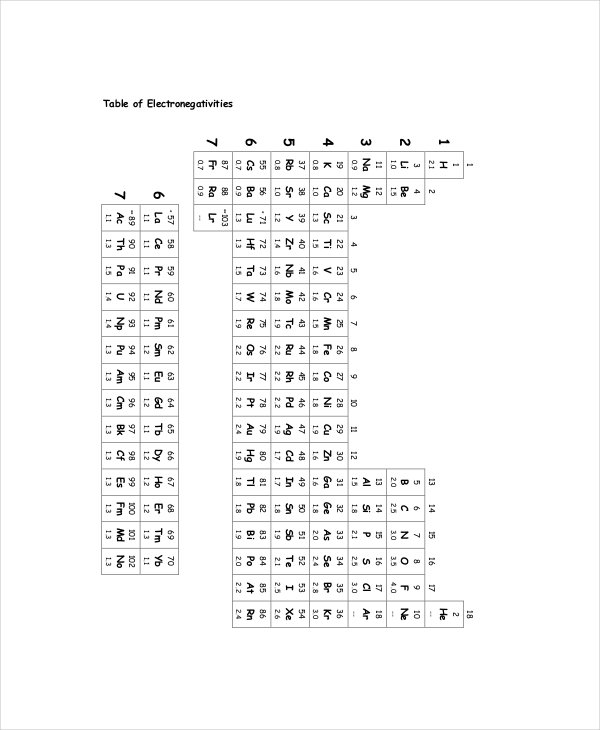
If you have never had chemistry class, you may not have heard about electronegativity chart before. People who have taken the subject or they may have worked in the industry always need such a chart – it provides a kind of guidance for those who want to get information.
- 12+ Itinerary Template for Your Trip
- 6+ Tracks Your Workflow with Flow Chart Template
- 20+ Excel Budget Template
- 11+ How to Fill the Fax Cover Sheet Sample Template Online
- 3+ Beautiful and Free Snowflake Template for Your Christmas
About Electronegativity
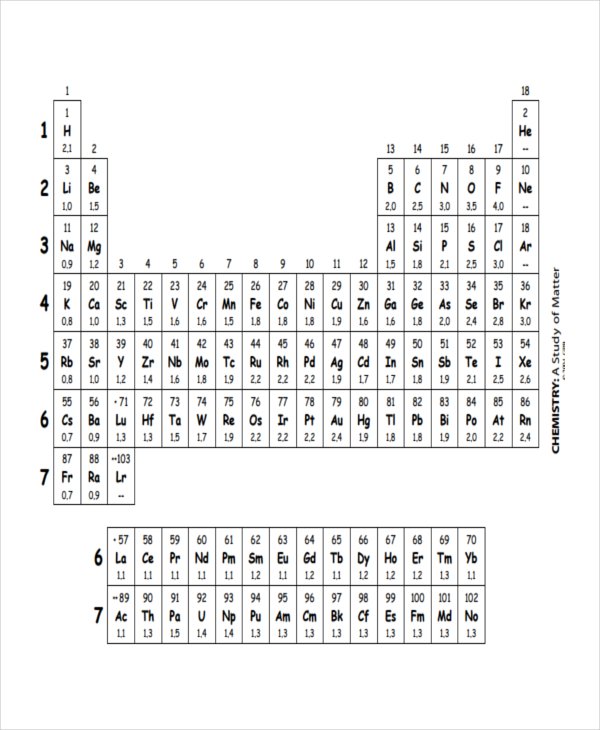
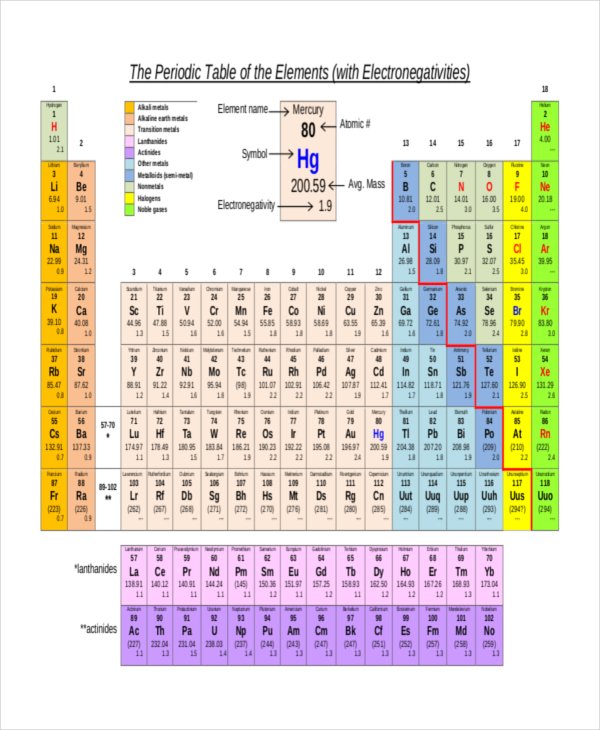
You probably have heard about Periodic Table before and how it connects to the electronegativity chart. There is a connection between the electronegativity, bond types, polar molecules, and polar bonds.

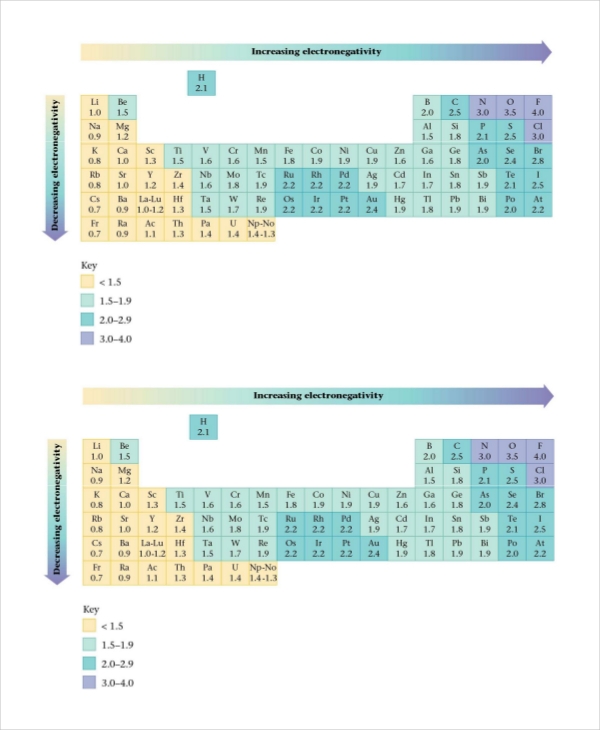
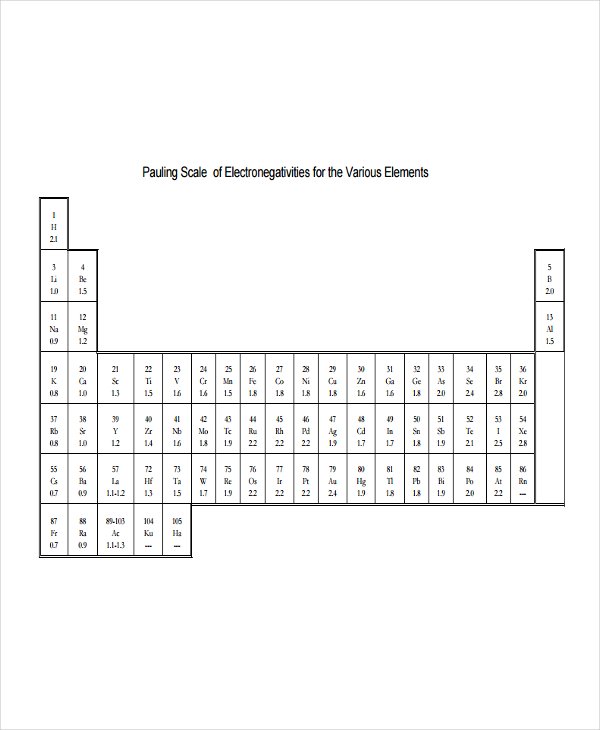
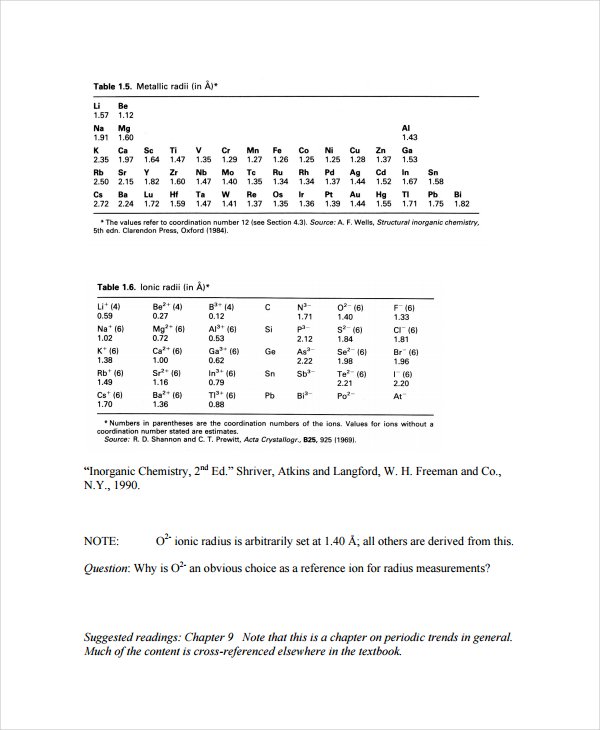
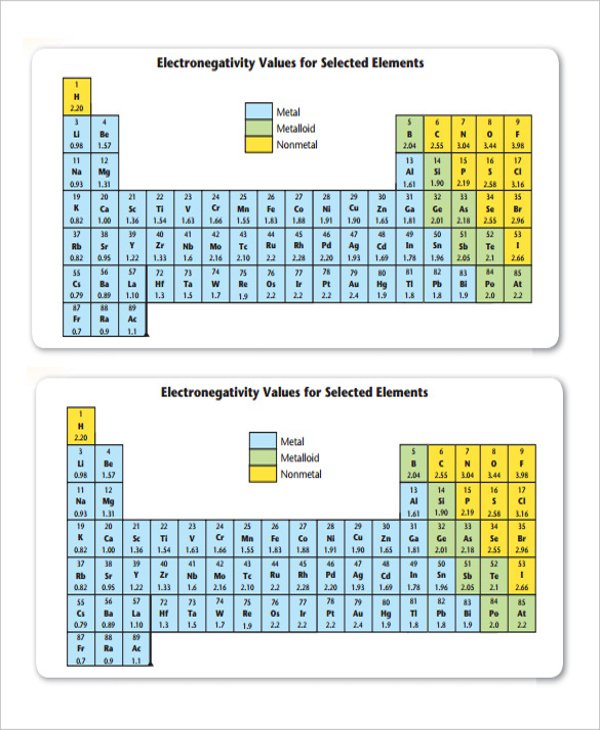
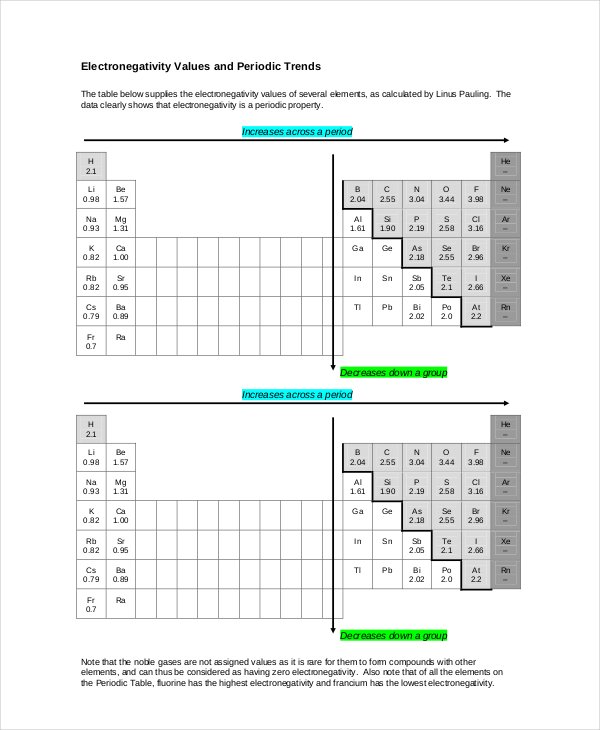
Electronegativity is basically the measurement of an atom’s tendency to attract the electrons’ bonding pair. To measure such a thing, you may want to use the Pauling scale. The most electronegative element is Fluorine, and it has 4.0 assigned value. The values themselves are ranging to francium and caesium with the least electronegative, 0.7
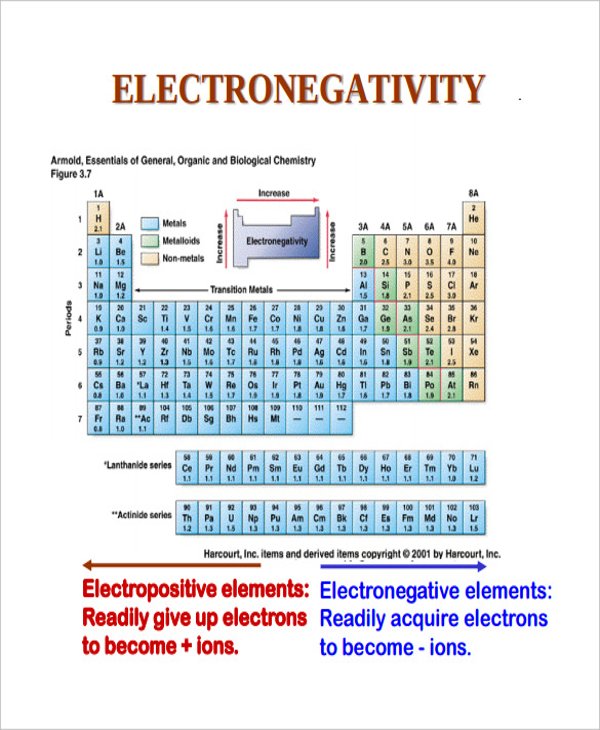
Atoms will likely bond between one another. Imagine two atoms that bond together, but the effect is different, depending on the types of the atom. When the atoms are both electronegative, they may attract electrons’ bonding pair and they can be found on the half average between the atoms. This is known as the pure bond where electrons will be evenly shared between two atoms. What if one atom has more electronegative than the other? Let’s say that B is more electronegative than the A. B will have more bonding share to electron density. In the end, it creates polar bonds where one end is slightly negative while one end is slightly positive.
How to Use the Chart
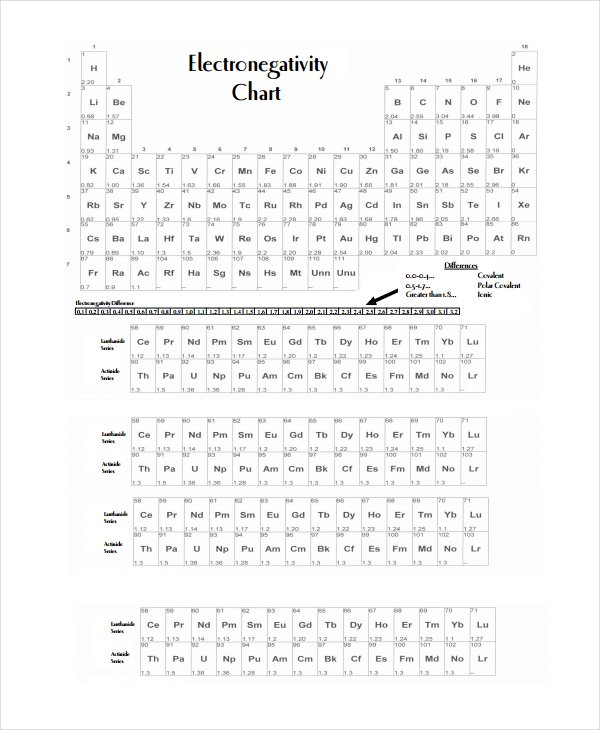
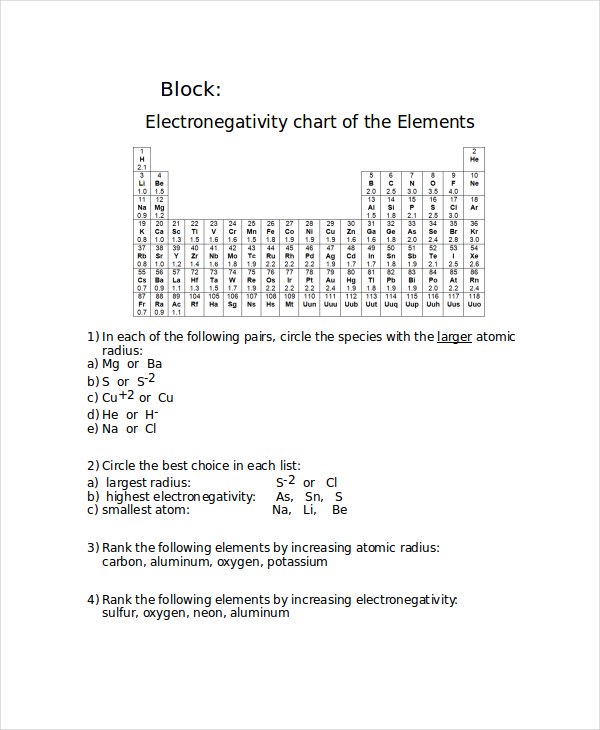
So, how is the electronegativity chart used? It is basically used to measure, or at least estimate, the electronegativity when compared to other atom. The measurement alone is based on the location on the periodic table. Even if you can’t calculate the value, you can still evaluate the electronegativity differences. Here are some of the rules:
- If you move more to the right (of the periodic table), the electronegativity tends to be higher
- If you move more upward, the electronegativity will be higher too
- Atoms on the bottom left are likely having the lowest electronegativities while the top right having the highest ones. For instance, the NaCl in which the Chlorine has higher electronegativity than Sodium. Chlorine is close to the top right while Sodium is on the left side.
Consulting the Right Sources
As it was mentioned before, the chart may not be important for you but it is important for those working in the chemistry industry – or anything related to it. Sometimes, getting such a specific information can be difficult, especially if the subject isn’t too general. If you want to get a reliable data or information, here is what you can do:
- Make sure that the source is valid and trusted. Aside from the layout of the site, you can also read reviews or feedbacks.
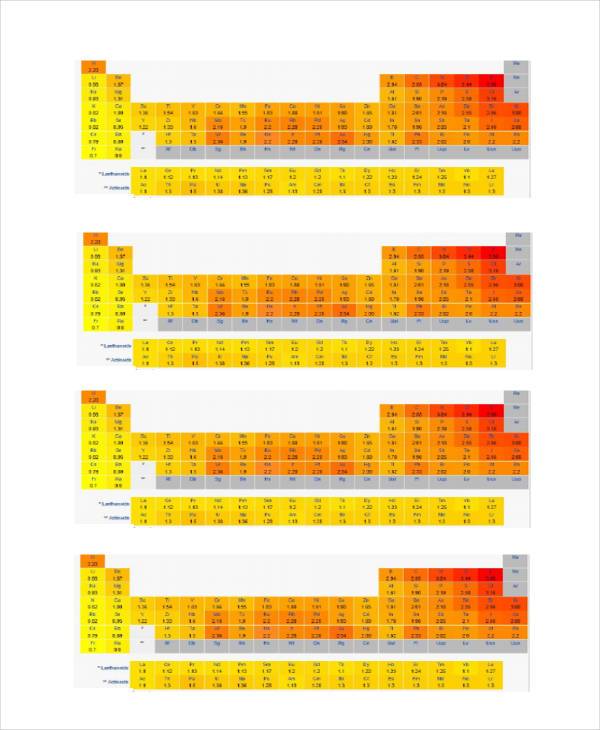
- Reliable sources should come with various options – and getting the charts should be easy. Users like you should have different kinds of download options
- The download process won’t be difficult or complicated. Not only will you have various kinds of electronegativity chart, getting your hands on them should be easy too.