Comparison Chart Template: Principles in Making Comparison Chart
A comparison chart can come in handy when you need to buy something but not sure which one suits your need the best. This is because you will know how stuff is compared by their sizes, price, features, and so on. For sellers, designing a comparison chart template can attract more potential buyers as it will give them all information they need to know about your product and acknowledging what you offer.
How to make a comparison chart
As it can be useful for both sellers as well as buyers, a comparison chart must be well made, that is when you can make use of a comparison chart template as your helper. However, getting the template is not enough to get the job done. You need to know how to make it by knowing what you should do to fill out the information inside the chart.
- Card Template Free Printable
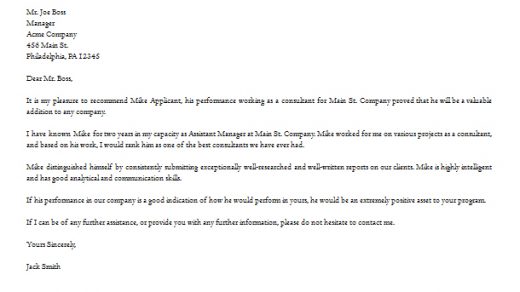
- Generic Printable Job Application
- Free Gradebook Printable
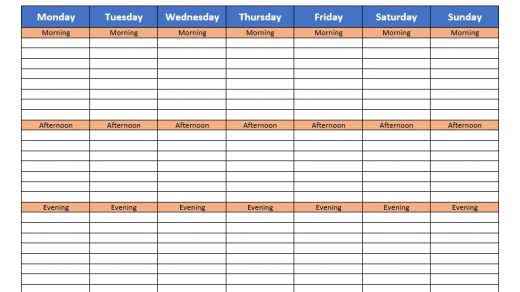
- Free Printable Schedule Template
- Printable Receipt For Payment
In comparing, first, you need to research to collect all the data that are needed. when you compare things, you should hold them under the same standard. Choose the top products to be reviewed as readers will likely trust companies that recommend the best products. Then after that, you can choose what features you will compare.
The Principles in making a comparison chart
The principles here are to guide before you decide on what type of comparison chart template that you will choose.
- Make it easy for eyes to see
The human brain can easily judge relative height compared to width. Based on this, bar and plot charts can be used generously as opposed to pie and area charts which should be limited.
- Gentle and soft colors
Eyes will attract more to colors, so it is better to serve a difference in colors. However, avoid using colors with high contrast as they will make eyes uncomfortable. Use soft and gentle conservative colors that are preferred by corporate audiences.
- Fewer digits
By presenting large
numbers in the breviary, it helps our eyes and brain feel less tired which results in easier for the audience to understand the chart.
- Less information in one slide
Avoid putting too much information in one slide. You can always add another slide rather than overload information in 1 slide.
- Compare in column
When watching data in a row, our eyes are forced to move back and forth. The column is easier to read as eyes can glance to the side to see the difference of the value.
All principles above are made so that your comparison chart template is easy to look at and to understand. Charts with numbers are usually harder to read, it is better to keep those principles in mind if you want to design a visual data.
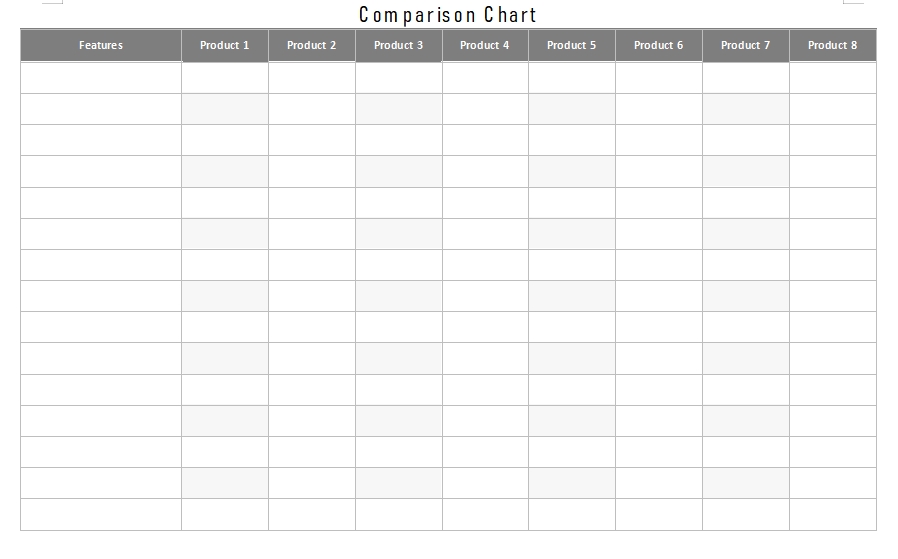
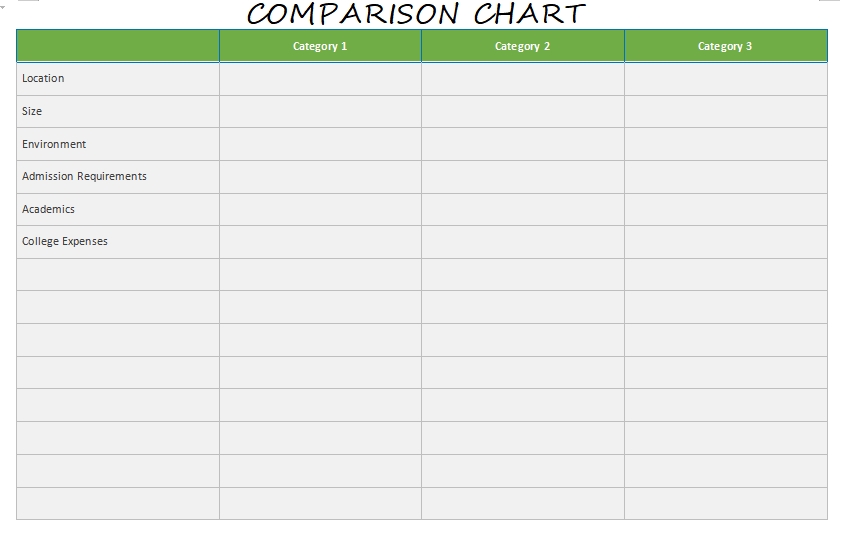
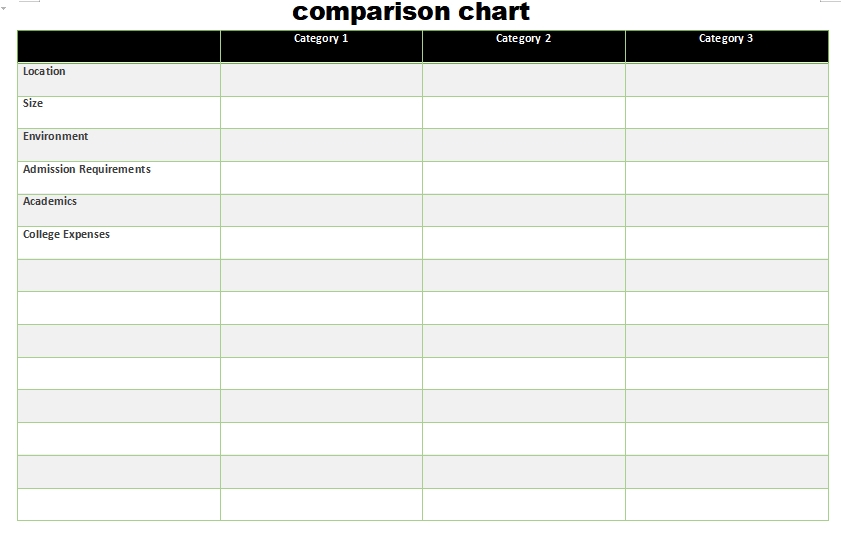
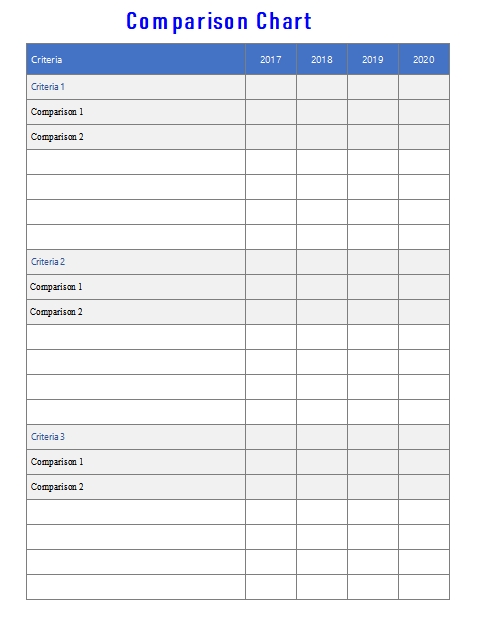
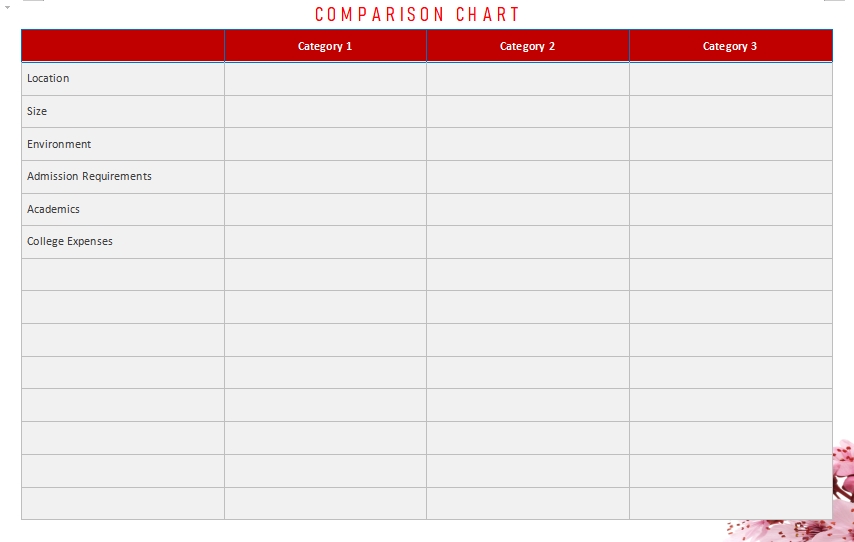
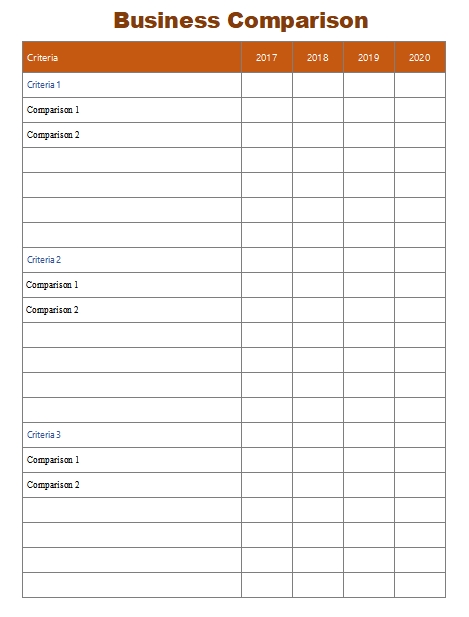
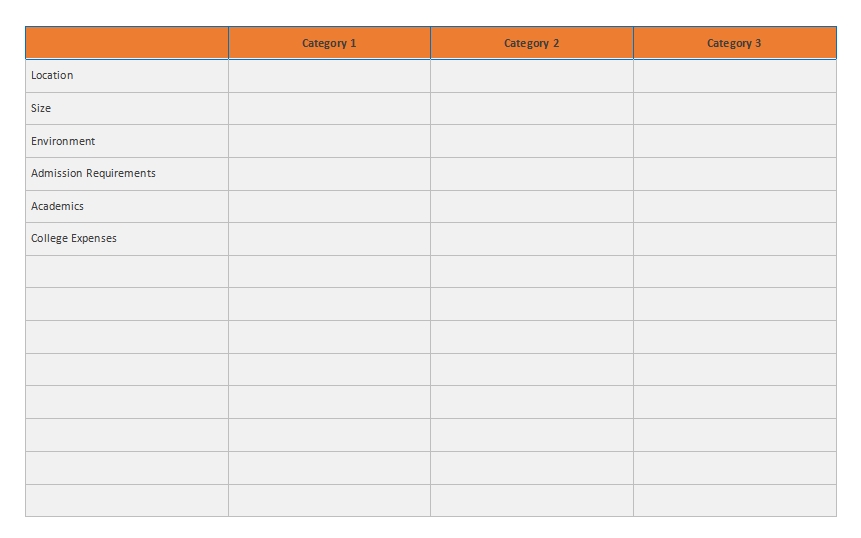
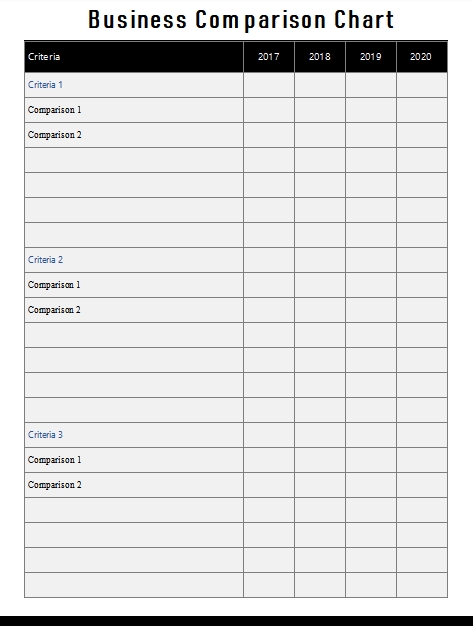
comparison chart Example
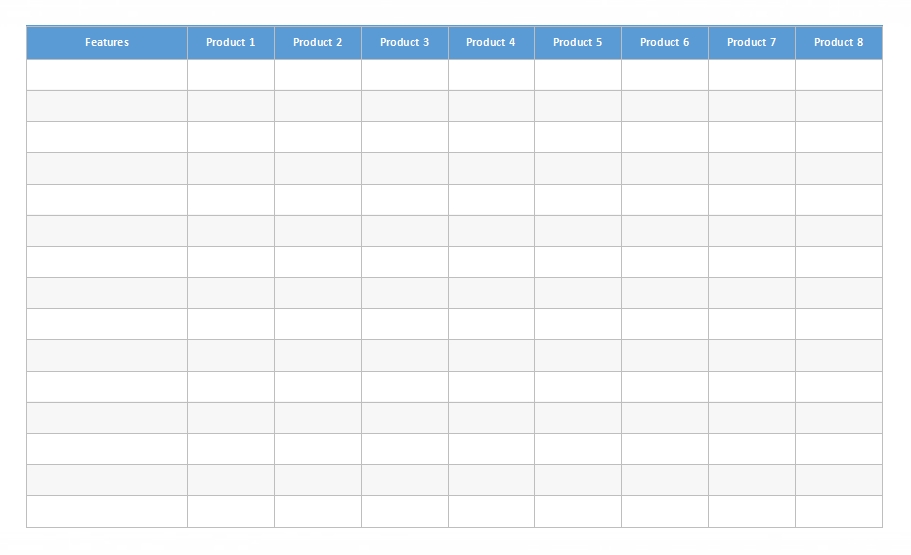
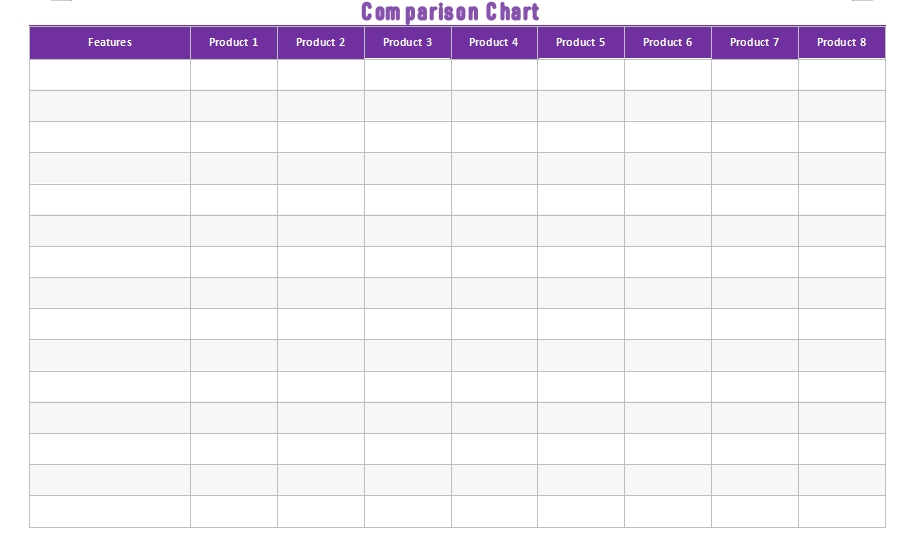
comparison chart Ideas